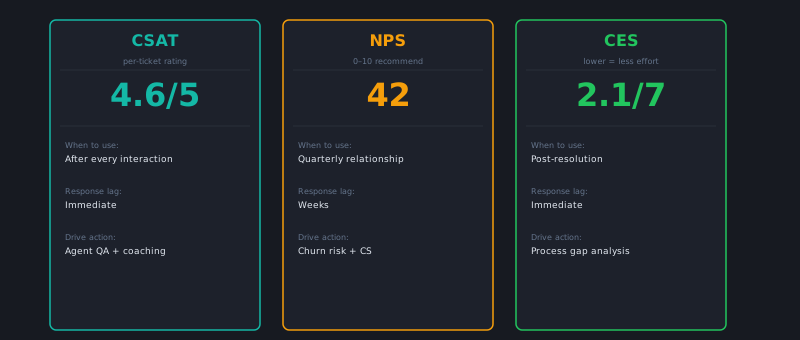
Support teams spend a lot of time debating which satisfaction metric to track. The debate usually produces an answer — “we use CSAT” — without much examination of whether CSAT is actually answering the questions the team needs answered. The choice matters because each of the three major satisfaction metrics measures something meaningfully different, and tracking the wrong one can give you confidence in metrics that don’t predict the outcomes you care about.
What each metric actually measures
CSAT (Customer Satisfaction Score)
CSAT asks: “How satisfied were you with your support experience?” Typically rated on a 1–5 scale, with CSAT calculated as the percentage of respondents who rated 4 or 5.
CSAT is transactional. It measures satisfaction with a specific interaction — this ticket, this call, this conversation — immediately after it happens. It tells you whether the individual support experience was good or bad, not whether the customer is satisfied with the product overall.
What CSAT is good for: Monitoring support interaction quality, identifying individual agent or channel performance issues, and catching specific ticket categories that are generating dissatisfaction.
What CSAT misses: A customer can give you a 5/5 CSAT score for a support interaction and still churn the next month. They were satisfied with how the agent handled them, but they’re still frustrated with a bug that keeps coming back, or a pricing change they disagree with. CSAT doesn’t capture that.
NPS (Net Promoter Score)
NPS asks: “How likely are you to recommend this company to a friend or colleague?” Rated 0–10, NPS is calculated as the percentage of Promoters (9–10) minus the percentage of Detractors (0–6).
NPS is relational. It measures overall sentiment toward the company, not any single interaction. When sent periodically (quarterly or at relationship milestones), NPS captures the cumulative effect of product, pricing, sales, and support on how a customer feels about you overall.
What NPS is good for: Measuring overall customer health, predicting churn and expansion risk, and identifying which customer segments are at risk. NPS is a useful leading indicator for revenue outcomes.
What NPS misses: NPS is a poor diagnostic tool. A declining NPS score tells you something is wrong but not what or where. Was it a recent product change? A support experience? A competitor’s outreach? NPS alone can’t answer that. It also has significant response bias — customers with strong opinions (very happy or very angry) are more likely to respond, which skews the distribution.
CES (Customer Effort Score)
CES asks: “How easy was it to get your issue resolved?” Typically rated on a 1–7 scale, CES measures the effort a customer had to exert to accomplish something.
CES is effort-oriented. The underlying hypothesis — well-supported by research from CEB/Gartner — is that reducing customer effort is a stronger driver of loyalty than delighting customers. In other words, customers who had an effortless support experience are more likely to renew than customers who were wowed.
What CES is good for: Identifying friction in your support process — long response times, too many handoffs, having to repeat information to multiple agents. CES is particularly useful for self-service optimization: if customers find it hard to resolve issues on their own, CES surfaces that.
What CES misses: CES doesn’t capture whether the issue was actually resolved well, and it’s not useful at a company relationship level the way NPS is. A customer can rate an interaction as low-effort but still be unhappy with the outcome.
The practical decision
Rather than asking “which metric should we use,” ask “what question do we need answered?”
| Question | Metric |
|---|---|
| Is this support interaction good or bad? | CSAT |
| Is this customer at risk of churning? | NPS |
| Is our process creating unnecessary friction? | CES |
| Are customers likely to expand their contract? | NPS |
| Which agent or channel is underperforming? | CSAT |
| Is self-service working? | CES |
Most mature support orgs use at least two of the three. The most common combination is CSAT + NPS: CSAT for interaction-level quality monitoring, NPS for relationship-level health tracking.
Adding CES makes sense when your support process involves multiple steps or handoffs, or when you’re actively trying to improve self-service. If your main concern is whether agents are performing well, CSAT gives you faster and more actionable signal than CES.
Survey timing and response rates
All three metrics suffer from the same problem: most customers don’t fill out surveys. Response rates of 10–20% are common. That’s not necessarily a problem if your non-response isn’t systematically biased — but it usually is. Customers who just had a frustrating experience are more likely to respond to a survey than customers who had a smooth one, which can make your scores look worse than reality.
Some timing guidance:
- CSAT: Send immediately after ticket close (within 1 hour). Every additional hour of delay reduces response rate by roughly 5%. Keep the survey to 1–2 questions.
- NPS: Send periodically (every 90 days for customers over 6 months) or at relationship milestones (90 days post-onboarding, at renewal). Never send NPS immediately after a support interaction.
- CES: Send immediately after a self-service or support resolution attempt, before the customer has fully disengaged.
When the metrics diverge
The most informative situation is when your metrics tell conflicting stories:
- High CSAT, declining NPS: Support interactions are fine but something bigger is going wrong — product quality, pricing, or competitive pressure. This is not a support problem.
- High CSAT, high CES: Agents are doing good work but the process is making customers work too hard to reach them. Look at channel accessibility, wait times, and how many handoffs a typical issue requires.
- Low CSAT, low NPS in a specific cohort: A segment-specific problem — maybe a product tier with a recurring bug, or an onboarding flow that creates repeated friction.
The metrics are most valuable as a system, not individually. Tracking all three gives you the ability to triangulate — to know not just that something is wrong, but roughly where to look.
One detail worth noting: satisfaction scores from AI-resolved tickets often behave differently from agent-resolved tickets. Customers who get an instant, accurate AI response sometimes rate satisfaction higher than customers who waited for a human — but the NPS effect is flatter. If you’re running or evaluating an AI resolution layer, track satisfaction separately by resolution type so you’re not blending signals. cx.aitocha.com tracks CSAT and CES natively at the ticket level, giving you the granular data to separate channel-level from issue-level satisfaction.