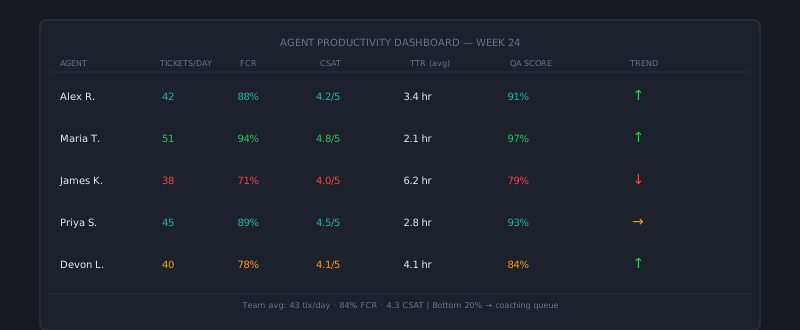
Agent productivity measurement is one of the places support operations most frequently goes wrong. The temptation is to track everything — tickets closed per hour, handle time, response rate, utilization percentage — and surface all of it to agents in real time. The result is usually a team optimized for metric performance rather than customer outcomes: fast replies that don’t answer the question, tickets closed before resolution, and agents gaming whatever number is most visible.
The goal is to measure in a way that gives agents useful feedback and leaders useful visibility, without creating incentive structures that hurt customers.
The productivity measurement trap
Tickets-per-hour is the canonical trap metric. It’s concrete, real-time, and easy to compare across agents. It also rewards speed regardless of quality, creating implicit pressure to close tickets fast — not resolve them well.
The evidence shows up in downstream metrics: teams that lead with tickets-per-hour tend to have higher re-open rates (tickets closed before resolution), lower FCR (customers contact again for the same issue), and CSAT scores that are flat or declining despite “productivity” going up.
The fix isn’t abandoning throughput as a concept — it’s measuring it alongside quality metrics so that speed at the expense of quality shows up clearly.
A balanced productivity measurement framework
Productive agents close tickets efficiently and resolve issues completely and treat customers well. A measurement framework should reflect all three dimensions:
Throughput (volume):
- Tickets handled per shift
- Handle time (median, not average — averages are distorted by outliers)
- First reply time
Quality (resolution):
- First Contact Resolution rate (agent-level, not just team aggregate)
- Re-open rate (tickets that customers follow up on after close)
- QA scores (from your structured QA review process)
Customer outcome:
- Agent-level CSAT (requires enough volume to be statistically meaningful — usually 20+ scored tickets per month)
- Escalation rate (what percentage of agent’s tickets require escalation — high rates indicate knowledge or authority gaps)
The key is sharing these together, not in isolation. An agent with high throughput and low FCR is racing through tickets without resolving them. An agent with excellent FCR and QA scores but very low throughput may have a time-management issue or be taking on tickets above their skill level. Seeing all three dimensions simultaneously surfaces the actual picture.
How to share metrics with agents
The how matters as much as the what. Metrics shared in a punitive context (comparison rankings, visible to the whole team without context) create anxiety and gaming. Metrics shared in a developmental context create self-improvement.
Best practices:
Give agents visibility into their own numbers, not others’. An agent can see their own handle time, FCR, re-open rate, and QA scores. They can see team averages for comparison. They cannot see individual peer metrics. Peer comparison creates competition; team average comparison creates aspiration.
Share metrics weekly, not daily. Daily metrics are noisy — a single complex ticket can destroy a day’s handle time numbers. Weekly aggregates show meaningful patterns. Sharing too frequently trains agents to watch the number rather than focus on the customer.
Always pair metrics with context and coaching. A low FCR score in isolation is just discouraging. A low FCR score with “here are the three ticket categories where your re-open rate is highest, and here’s what we’ve seen work in those categories” is actionable.
Set clear expectations for what “good” looks like. Agents should know before they’re hired what performance expectations are. Publish team benchmark ranges (not individual rankings) so agents have a clear sense of where they stand.
Handle time: the nuanced one
Handle time — the average time an agent spends per ticket — is worth tracking carefully because it’s the metric most prone to misinterpretation.
A long average handle time can mean:
- The agent is working on complex tickets (appropriate)
- The agent is inefficient in their process (trainable)
- The agent is doing thorough, high-quality work (valuable, possibly excessive)
A short average handle time can mean:
- The agent is efficient and experienced (great)
- The agent is closing tickets before resolution (problem)
- The agent has a light ticket mix (comparison context issue)
The only useful handle time analysis is handle time segmented by ticket category. A billing specialist’s handle time on billing inquiries should be compared to other billing specialists — not to a general agent handling password resets. Category-level benchmarks take about 30 minutes to build once you have 90 days of data and are essential for handle time to be meaningful.
Utilization and schedule adherence
Utilization — the percentage of scheduled time an agent is actively working tickets — is a workforce management metric, not a quality metric. It tells you whether your staffing is efficient (too low means overstaffed; too high means burnout risk), but it says nothing about whether the work being done is good.
A target utilization of 75–85% is typically healthy for support agents. Below 70% suggests overstaffing or significant non-ticket work inflating scheduled time. Above 90% is a burnout signal — agents have no capacity to handle volume spikes and no time for learning and development.
Schedule adherence — whether agents are logged in and available when scheduled — is similarly a staffing metric. Track it for planning purposes, but don’t use it as a primary performance indicator for experienced agents who consistently deliver quality outcomes.
Productivity and development over time
The most useful productivity tracking over time is the trend line, not the absolute number. An agent who starts at 60th percentile FCR and improves to 80th percentile over six months has demonstrated meaningful development. An agent who has been at 65th percentile for eighteen months without movement may be in a plateau that coaching hasn’t addressed.
Monthly trend reviews — part of your regular 1:1 cadence — keep the conversation productive and forward-looking. The question is never “why were your numbers bad last week” — it’s “what patterns are we seeing in your data, and what do you think is driving them?”
Productivity measurement done well makes agents feel seen and supported, not watched and judged. The same metrics that help leaders spot problems early help agents understand their own development trajectory — when they’re presented with context, trend lines, and a coaching relationship rather than a leaderboard. AItocha CX tracks throughput, handle time, and quality metrics at the agent level without requiring manual data pulls.