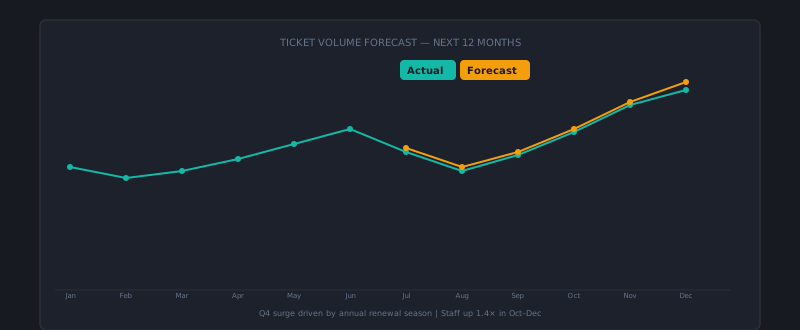
Most support teams hire reactively — volume climbs, quality drops, the team lead says they’re overwhelmed, and eventually a headcount request gets approved and a hire gets made 3–4 months after the problem started. The team that was understaffed for a quarter now has one more person, but the backlog built during that quarter hasn’t disappeared, and the new hire spends their first month catching up rather than contributing to capacity.
A functioning forecasting and capacity planning process breaks this cycle. Instead of reacting to capacity problems, you see them coming 2–3 months out and start the hiring process at the right time.
The two inputs to capacity planning
Capacity planning requires two things: a volume forecast (how many tickets are coming?) and a productivity model (how much can one agent handle?).
Volume forecasting starts with historical data. Pull at least 12 months of resolved ticket volume, segmented by week. Look for:
- Trend: Is volume growing, flat, or declining? What’s the month-over-month growth rate?
- Seasonality: Are there predictable peaks and troughs at certain times of year?
- Event-driven spikes: Product launches, marketing campaigns, billing cycles — do these produce reliably quantifiable volume increases?
With this data, you can build a forward projection. The simplest model: take trailing 90-day average volume, apply your observed growth rate, and adjust for known upcoming events. A more sophisticated model applies seasonal adjustments from prior year data and accounts for deflection from self-service improvements.
The productivity model defines how many tickets one agent can handle per week at the quality level your SLA and QA standards require. This is different from how many tickets an agent can close — it’s how many they can close well, within your FCR and CSAT targets.
Calculate from current data:
- Average weekly tickets per agent (for agents at full productivity, excluding new hires and recent joiners)
- Adjust down by your non-ticket time percentage (meetings, training, admin, PTO coverage): typically 20–25%
If your full-productivity agents handle 100 tickets per week and 20% of their time is non-ticket work, your effective productivity target is 80 tickets per week per agent for planning purposes.
Building the forecast model
A simple forecasting spreadsheet has three layers:
Layer 1 — Base volume projection:
Week | Historical avg | YoY growth factor | Projected volume
Layer 2 — Event adjustments:
Projected volume | Upcoming events | Event volume adjustment | Adjusted volume
Known events to account for: product releases (+25-50% spike week), major marketing campaigns (+15-30%), end-of-quarter billing (+10-20%), holidays (-20-40%).
Layer 3 — Deflection credits:
Adjusted volume | Expected deflection from self-service improvements | Net required volume
If you’re rolling out a new knowledge base feature or AI resolution layer, factor in the expected deflection gain. Be conservative on this — it’s better to have more capacity than to have hired assuming deflection gains that didn’t materialize.
Translating volume into headcount
With a weekly projected volume and a per-agent productivity number, the math is straightforward:
Required agents = Projected weekly volume / Agent weekly productivity
Add 15% buffer for attrition, PTO, and absences. Round up to whole agents.
Example:
- Projected volume in Q3: 1,800 tickets/week (up from current 1,500)
- Agent weekly productivity: 80 tickets
- Required agents: 1,800 / 80 = 22.5 → 23 agents
- Buffer (15%): 23 × 1.15 = 26.5 → 27 agents
- Current team: 22 agents
- Net hiring need: 5 agents over the next 3 months
If hiring takes 8 weeks from job posting to start date, and new agents reach full productivity at 8–10 weeks, you need to start hiring in the current month for agents to be fully productive by Q3 peak.
The quarterly capacity review
Run a formal capacity review each quarter:
- Actual vs. forecast variance: Did actual volume match the forecast? If not, why — was the model wrong or did the business change unexpectedly?
- Updated volume projection for next 2 quarters: Update the base volume with current data, revise event adjustments
- Current team capacity vs. requirement: Headcount, actual productivity (is the team at expected productivity levels?), upcoming attrition risk
- Hiring plan: How many offers to extend, timeline, lead time
- Risk scenario: What happens if volume comes in 20% above forecast? Is there a contingency (contractors, extended hours, overtime) or does the team go underwater?
This review produces a hiring plan with specifics: how many agents to hire, when job postings need to go live, when offers need to be extended, and when new agents need to be onboarded.
Present this to your VP quarterly, not as a request but as a plan. “Based on our volume forecast, we need to hire 3 agents by October to maintain SLA compliance through Q4” is a planning communication, not a budget negotiation. Having data behind it changes the conversation significantly.
Leading indicators to watch between reviews
The quarterly review sets the plan; leading indicators tell you when the plan needs revision:
- Ticket volume growth rate accelerating: If volume is growing faster than the baseline assumption in your model, update the model and pull forward the hiring timeline
- Agent utilization above 85%: Sustained high utilization means the team is running out of capacity buffer. At 90%+ utilization for more than two weeks, start the hiring process even if the quarterly review is still a month away
- SLA compliance declining: Falling SLA rates are a lagging indicator that capacity is already insufficient. If this is happening, you needed to hire 6 weeks ago — start immediately
- QA scores declining without an obvious quality cause: Quality often degrades before SLA does when volume outpaces capacity. Agents take shortcuts under pressure. Declining quality scores can be an early signal of capacity stress before SLA numbers reflect it
Capacity planning is fundamentally about turning uncertainty into preparedness. You won’t forecast perfectly — the model will be wrong in specifics. But the discipline of forecasting means you’re wrong in a smaller direction and earlier, rather than discovering the problem when it’s already a crisis. AI-first support platforms like AItocha CX exports the historical volume and handle-time data that feeds directly into capacity planning models.