The reporting problem
Most support reports are written for support people, not for leadership. They’re full of metrics that require domain knowledge to interpret, presented without context about whether they’re good or bad, and absent any connection to business outcomes that leadership is responsible for.
The result is a report that gets skimmed, not read.
What leadership actually cares about
Leadership cares about four things in relation to support:
- Are customers happy? (And is that improving or declining?)
- Are we spending the right amount on support? (Is cost trending correctly?)
- Is support creating or preventing customer churn? (Revenue impact)
- Are there problems we need to make decisions about? (Actions required)
Every metric in your leadership report should map to one of these four questions.
The one-page format
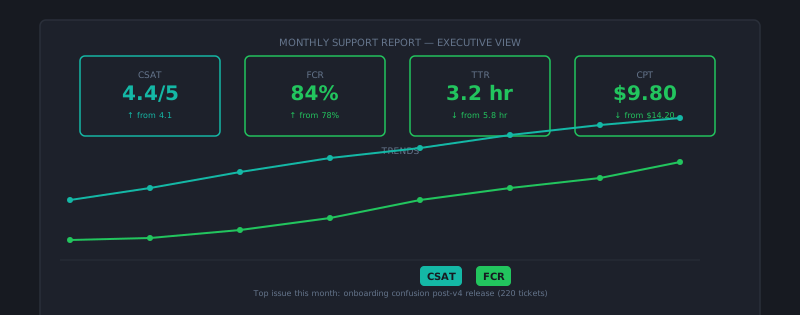
Header (three numbers): CSAT score vs. last period vs. target. Total ticket volume vs. last period. Cost per ticket vs. last period. These three tell the story at a glance.
Trend section (two charts): CSAT over 12 months. Ticket volume over 12 months. Charts show trends; point-in-time numbers hide them.
Business impact (two to three sentences): “Customers who rated their support experience as satisfied in Q3 renewed at a 12% higher rate than dissatisfied customers, representing approximately $X in protected revenue.” This is the section most support leaders don’t write and most leadership audiences most want to read.
Actions required (bulleted list): What decisions or resources does support need from leadership? Be specific: not “we need more headcount” but “at current growth rate, we will miss SLA in Q1 without two additional agents — attached is the capacity model.”
Frequency and format
Monthly for operational metrics. Quarterly for trend analysis and strategic items. Always in a format that can be read in under 5 minutes. If a leader has to ask “what does this mean?”, the report hasn’t done its job. cx.aitocha.com surfaces the metrics leadership actually cares about — customer effort, first-contact resolution, repeat contact rate — without requiring custom dashboard work.